top of page
home.png
home circle.png
data viz.png
page_elements.png

Below is a selection of my data visualization work.

Clink on any image to learn more.

Curiosity Gap — 'The Squeeze' on women's earnings

Screenshot 2026-05-29 at 2.36.27 PM.png

Curiosity Gap — Inflation is Worse Than it Seems

Screen Shot 2026-06-01 at 1.18.52 PM.png

Curiosity Gap — Where Running Water is a Luxury

water map.png

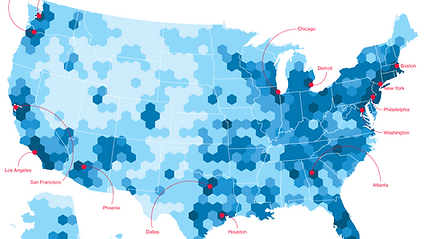
Bloomberg Businessweek — feature stories

BACKPAGE MARCH.jpg

Atmos — Dust & Bones

Untitled_Artwork 7.gif

Bloomberg Businessweek — The Man Meltdown

Screenshot 2025-04-22 at 9.53.02 AM.png

Our World in Data

War deaths viz FINAL FINAL_War Death toll- landscape.png

The Atlantic — Zone of Legislative Death

Zone_of_legislative_death_artboard_5 2.jpg

How informed am I really?

Week of May 11 Online News Consumption Map.jpg

The Sexual Revolution

Sexual revolution.png

Childhood in Transit

Childhood in Transit NEW.png

Time to Diagnosis

EDS diagnosis disparity-01.png

The Atlantic — Louisiana Chemical Plants
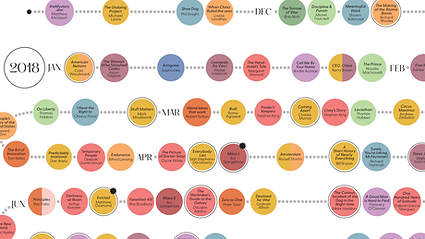
merged_plantation_chemical_plant_map 2.jpg

A Journey in Pages

Artboard 2_4x.png

A Week in the Life

article postcard front_.jpg
hillary 2.jpg
home.png
home circle.png
data viz.png
Untitled_Artwork.png
bottom of page